What industries use steel products the most? The answer depends on whether we measure steel by weight, spending, or finished products. Construction is usually the largest user, with steel reinforcing concrete, framing warehouses, and supporting bridges. Transportation and machinery also rely heavily on it: think rail tracks, truck frames, ship plates, and factory equipment. Energy adds another major share through pipelines, wind towers, and power infrastructure.
World Steel Association Director General Edwin Basson has highlighted steel’s long life cycle, noting, “Steel is the most recycled material in the world.” That matters when comparing industries: a steel beam may remain in a building for decades, while a vehicle contains steel in many smaller parts. Demand figures do not always tell the whole story.
This guide looks at the industries with the greatest steel use, what they make, and why their demand changes. It also separates raw steel consumption from steel-containing products, which are easy to confuse. A surge in construction can lift demand quickly. A slowdown can leave mills and suppliers adjusting their plans. The picture is useful, but not perfectly tidy. Industry categories overlap, and estimates vary by source and year. We’ll make those limits visible rather than pretend one ranking fits every market.
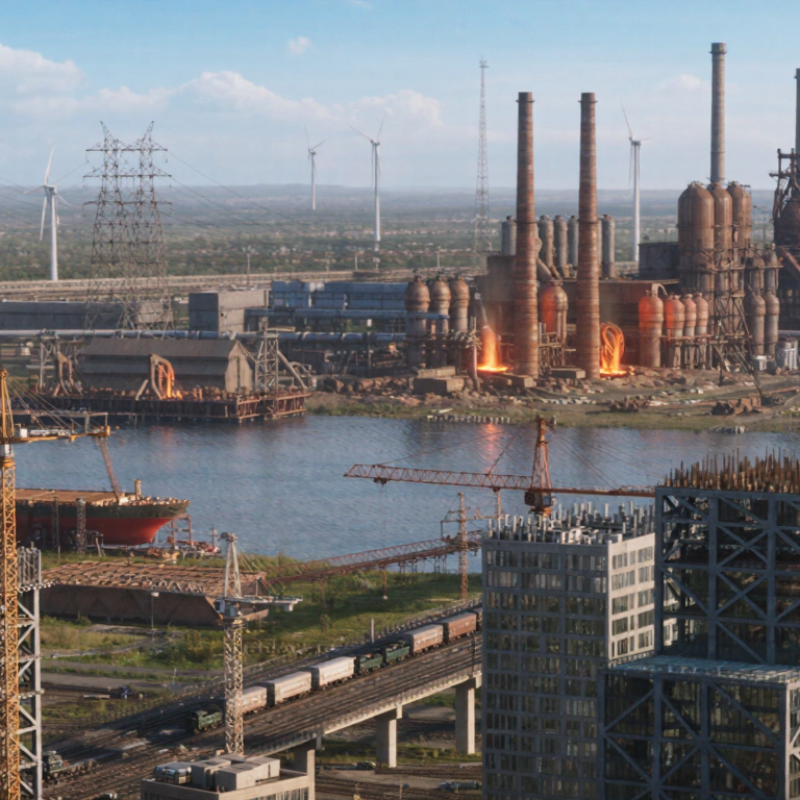
To identify which industries use the most steel, define “use” before comparing sectors. A useful measure is the share of finished steel consumed by each end-use industry, rather than the steel produced by mills or purchased by distributors. This keeps construction, vehicle manufacturing, and machinery on a comparable basis. That distinction matters.
The World Steel Association’s World Steel in Figures 2024 estimates that construction accounted for about 52% of global steel use, compared with 16% for mechanical equipment and 12% for automotive manufacturing. These shares show why concrete reinforcement bars, structural beams, and building frames matter so much in the global total. A vehicle factory may use less steel overall than construction, yet its demand is concentrated in visible products such as body panels and chassis.
Compare sectors using the same geography, year, and accounting boundary. Count steel where it enters its final industry, not once as a coil and again inside a finished product. The data are estimates, and sector definitions can differ across reports. A steel-content estimate for buildings may also miss some imported components. That limitation is worth noting. When precision matters, pair global figures with national material-flow or industry-use statistics, and state whether the measure covers apparent consumption or steel embodied in finished goods.
Metric: Estimated share of global steel use by end-use sector. The figures below are indicative published sector estimates, not 2026 forecasts; they are rounded independently and therefore do not sum to 100%.
| Rank | End-use industry | Indicative share of steel use | Typical steel-using products and applications | How to interpret the metric |
|---|---|---|---|---|
| 1 | Construction | About 52% | Buildings, bridges, rail infrastructure, reinforcing bar, structural sections, and steel plate | The largest end-use category, reflecting steel used in buildings and infrastructure. |
| 2 | Mechanical machinery | About 16% | Industrial machinery, agricultural equipment, machine tools, and engineering components | Includes steel incorporated into machinery and equipment across many industries. |
| 3 | Automotive | About 12% | Passenger vehicles, commercial vehicles, body structures, chassis, and components | Measures steel used in vehicle manufacturing, rather than vehicle sales or fleet size. |
| 4 | Metal products | About 10% | Fabricated metal goods, containers, fasteners, hand tools, and metal structures | Covers fabricated products that do not fall into a more specific end-use category. |
| 5 | Other transport | About 5% | Railway equipment, ships, aircraft-related applications, and other transport equipment | Transport uses other than the separately classified automotive sector. |
| 6 | Domestic appliances | About 3% | Major household appliances and related steel housings and components | A smaller category that can vary with appliance production and material design. |
| 7 | Electrical equipment | About 3% | Electrical machinery, power equipment, and steel enclosures | Steel use in electrical equipment; this is distinct from electricity generation. |
| 8 | Other uses | About 1% | Applications not assigned to the main published end-use groups | A residual category; definitions can differ among statistical series. |
Source and comparison note: Sector shares are indicative estimates from the World Steel Association’s published steel-use-by-sector breakdown. For a fair comparison, use the same geographic scope, year, product coverage, and end-use classification for every sector.
Construction accounts for about 52% of global steel use. That includes buildings, bridges, and infrastructure.
Reinforcing bars strengthen concrete. Roof sheets, beams, and bridge components are also widely used.
No. The figure is a global estimate, not a fixed share for every country or year.
Building activity and infrastructure investment vary. A city building rail lines may have a different pattern from a region focused on housing.
Machinery and transport also use substantial volumes. Their rankings can change when construction is divided into narrower categories.
No. Production measures steel output, not its final destination. A country producing more steel does not necessarily use more in one industry.
Check the year, region, and measurement scope. Reports may count steel use, apparent consumption, or production.
It is a starting point. Grouping buildings and infrastructure makes comparisons easier, but can hide useful detail. I may be oversimplifying.
What industries use steel products the most? The answer depends on how steel use is measured, but comparing end-use industries by their share of total steel consumption provides a useful overview. Construction leads by a wide margin, accounting for about 52% of global use. Its demand comes from buildings and infrastructure, where steel supports structures and enables durable, versatile designs.
Machinery uses approximately 16% of steel, followed by the automotive industry at 12% and metal products at 10%. Other transportation accounts for around 5%, while appliances and electrical equipment each use about 3%. These figures offer a broad global comparison, not a fixed ranking for every market. Steel consumption can vary by year and region, and results may also change depending on which products and applications are included. Check the data’s date, geographic coverage, and industry definitions before drawing conclusions about the most steel-intensive sectors.

 Campfire Steel